ATRA SAMPLE ANALYSES
Bivariate analyses is one of the simplest forms of Multi-Criteria analyses, which are specifically developed to aid decision-making in complex problems, such as aviation safety. Bivariate analysis involves the analysis of two criteria, for the purpose of determining potential relationship between them.
ATRA is proud to present some examples of bivariate analyses adapted to the aviation sector.
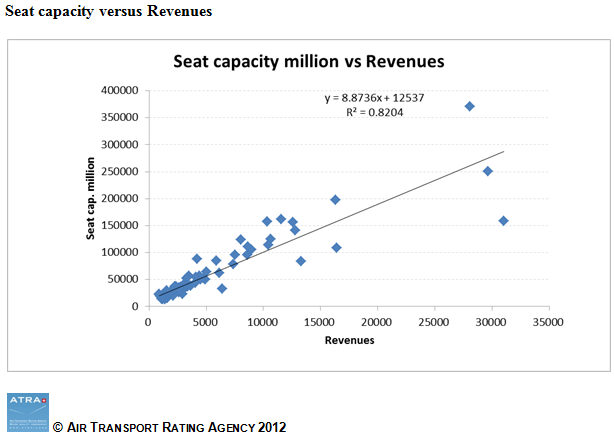
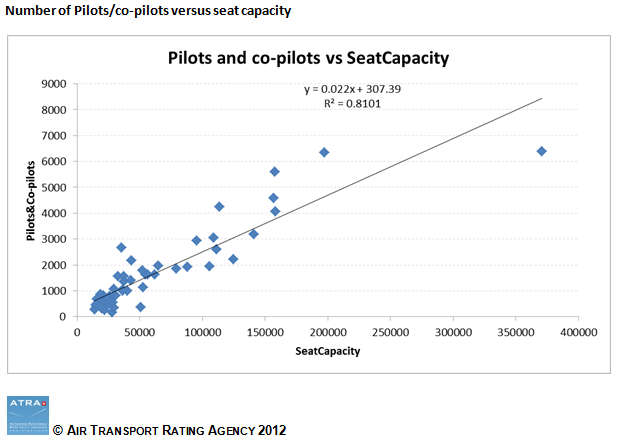
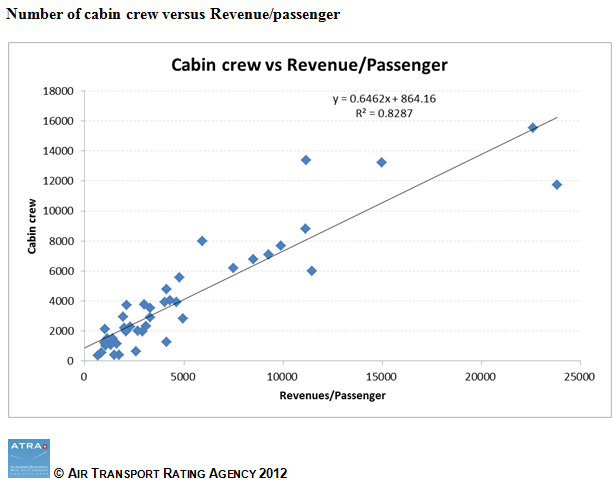
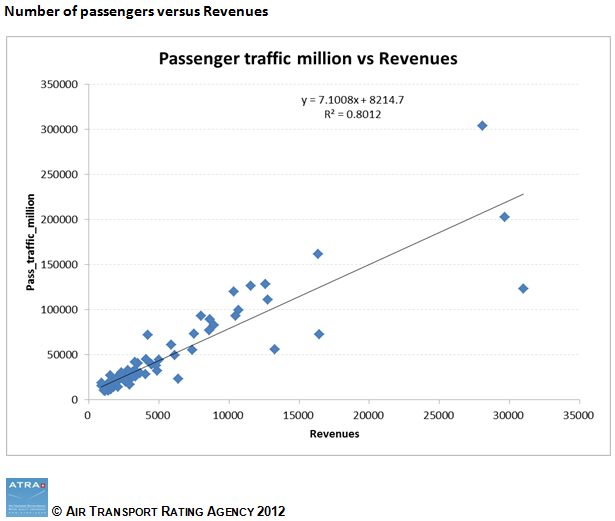
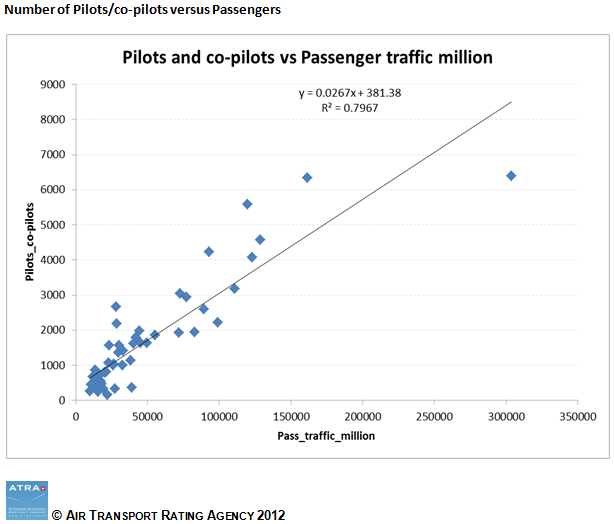
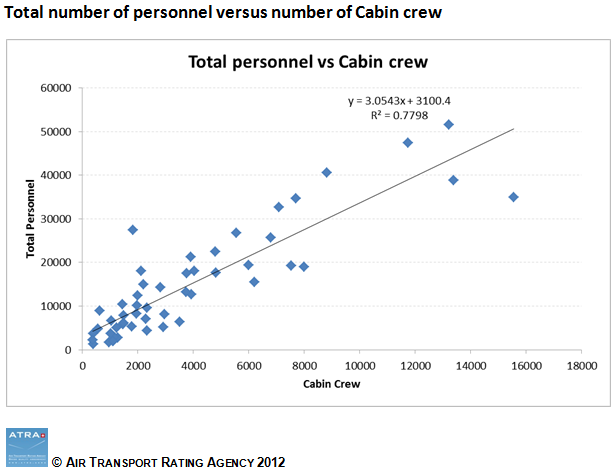
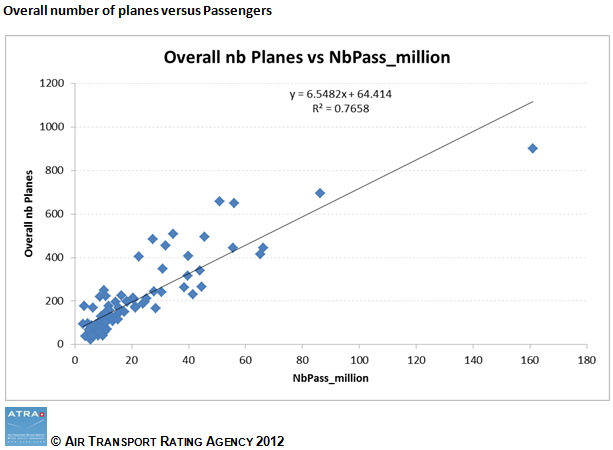
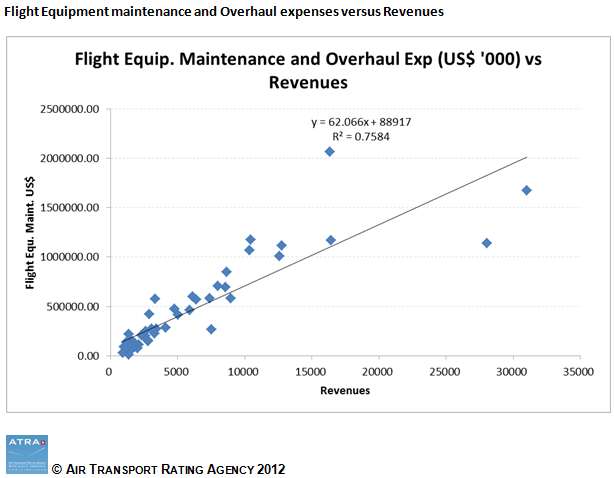
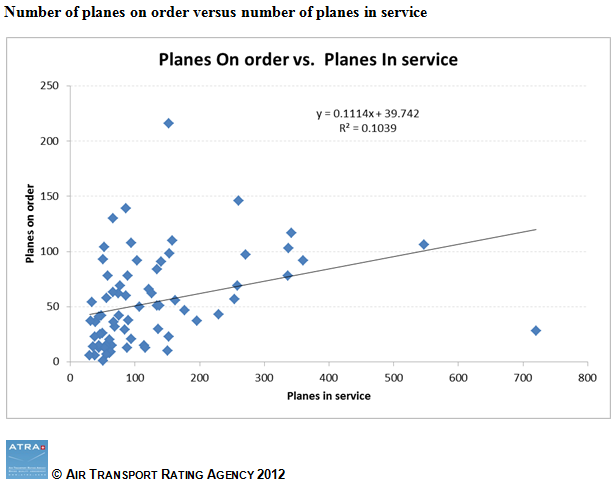
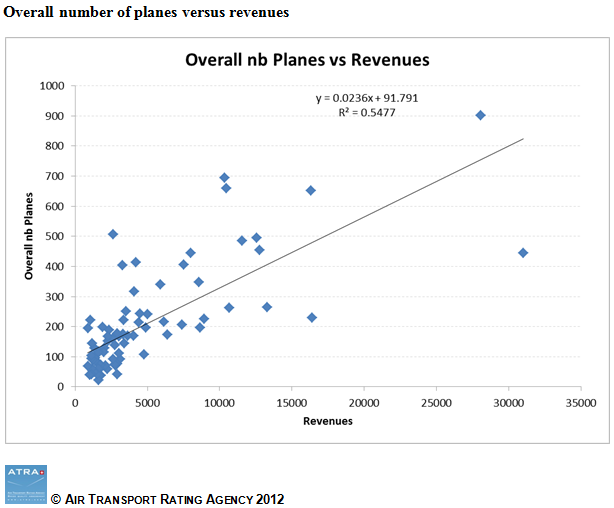
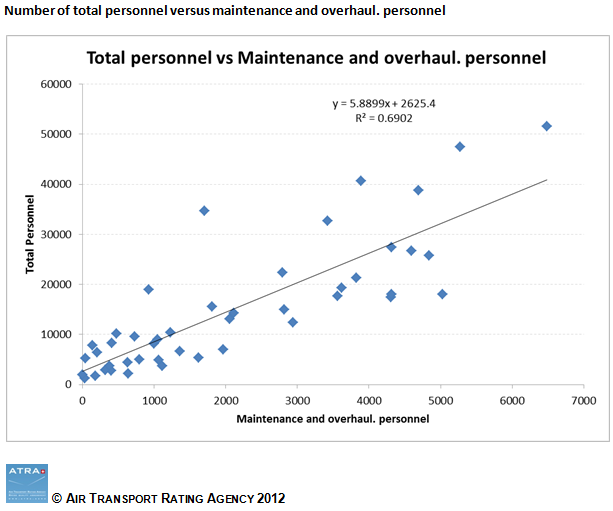
In order to study some of the more interesting variables appearing to be linearly correlated, linear regression analyses have been carried out between selected couples of features. Results have been computed using Airlines 2009.
In each graph/scatterplot we determine the linear function that allows computing the feature represented on the vertical axis (Y) from the value of the feature (X) represented on the horizontal axis. We have also represented the value of the coefficient of determination R² which indicates the percentage of variance of Y explained by X and vice versa. The main purpose of R² is to provide a measure of how well future outcomes are likely to be predicted by the linear model.
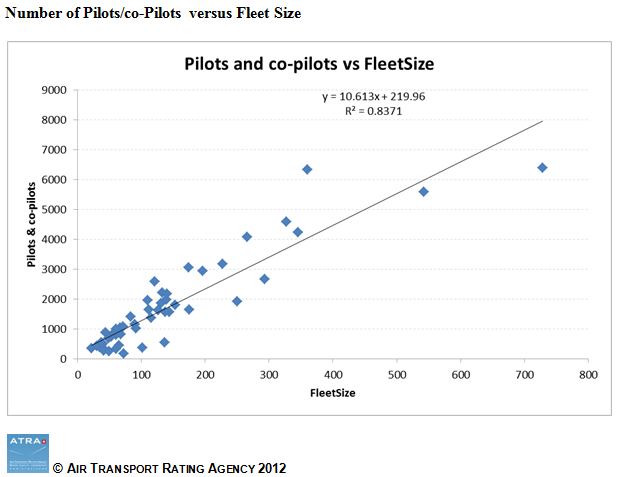
Example : “Pilots and co-pilots vs Fleet size”means that a relationship has been established between the two variables “Number of pilots and co-pilots” (vertical axis = Y) versus (vs) “Fleet size” (horizontal axis=X). The coefficient of determination R² is 0.83, which is a very good predictive value, confirming the quality of the model linking the two variables. This model allows to calculate (graphically or using the mathematical formula) the value of one variable, according to any value of the other variable.